Global network analysis configuration
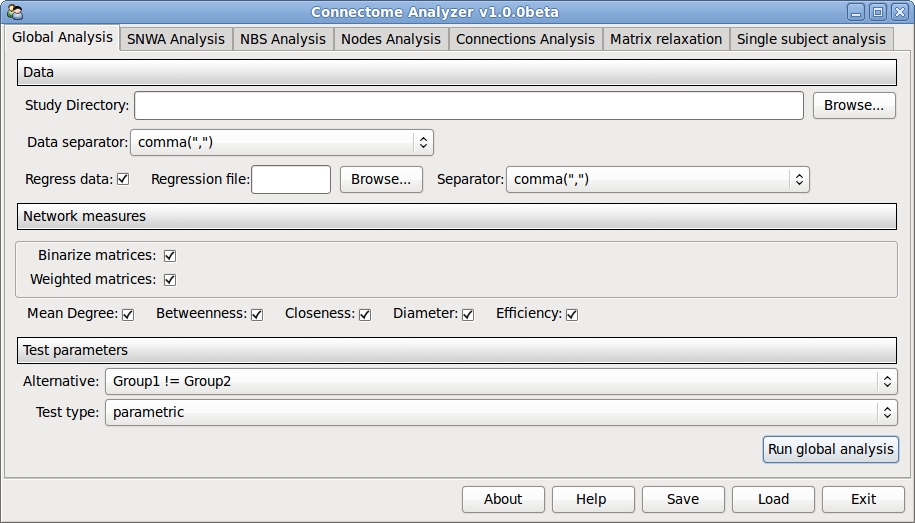
Study directory
Specify the directory where “Group1” and “Group2” are located
Data separator
If the data is in csv format, select the character that separates columns in the file. For matlab ”.mat” files, this setting is ignored
Regress data
Select if you want to regress data from the computed network measures before performing the statistical analysis. Specify a file where the regressors are stored. Note that only csv files are supported. This file should contain one line per subject (Group1 + Group2), one column with the subject filename (only the file name, eg: file_for_Subj1.csv) and one extra column per regressor.
Network measures
- You can choose to compute the network measures on:
- Non-Weighted graphs: the edge values represent the number of connections between the vertices
- Weighted graphs: the edge values represent some measure of the connection strength between the vertices
- Binarized graphs: the edges that have non-zero values are set to one before computing the network measures
- Select the set of measures you want to test:
- Mean degree: computes the mean degree of the adjacency matrix. If the matrix is weighted, the mean strength is computed
- Mean betweenness: computes the mean node betweenness
- Closeness: computes the mean closeness of the network
- Diameter: computes the mean diameter over the network
- Efficiency: compute the mean efficiency of the network
Test parameters
- Define how the test should be performed:
- Alternative: define the H1 hypothesis (Group1 != Group2, Group1 > Group2 or Group1 < Group2)
- Test type: define if the test should be parametric (Student t-test) or non-parametric (Wilcoxon test)